Video Retention Analytics: Finding Why Viewers Stop Watching
Every second a viewer stays — or leaves — tells you something critical about your content. Video retention analytics transform raw watch-time data into a precise diagnostic tool, revealing the exact moments where your storytelling, pacing, or packaging breaks down. Whether you're a solo creator or a brand publishing at scale, understanding your retention curve is the single most actionable step you can take to improve performance across every video you produce.
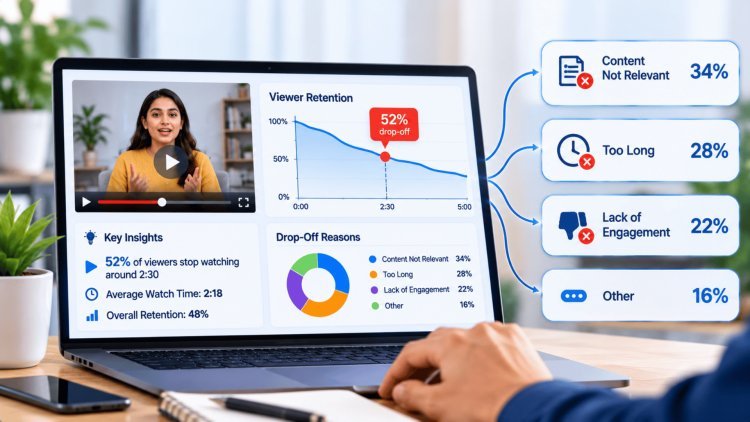
The Anatomy of the Retention Curve
A retention graph is fundamentally a survival curve — it tracks how many of your original viewers are still watching at each moment of your video. The horizontal axis represents time (from 0% to 100% of the video's duration), while the vertical axis shows the percentage of viewers who remain.
Think of it less like a report card and more like a heartbeat monitor: it pulses with your audience's real-time engagement decisions.
Real curves always slope downward. Viewer loss is inevitable and expected. No video — not even the most viral content on the internet — retains 100% of its audience to the final frame.
Success is measured not by achieving a flat line, but by the shape of the decline.
Sustained Interest
Strong Audience Match
Effective Pacing
Healthy Engagement
Broken Expectations
Weak Hook
Poor Pacing
Audience Disengagement
Using your YouTube retention reporting dashboard, you can pinpoint the precise timestamps where viewers abandon your content in disproportionate numbers. These "drop points" are not random — they are data-rich signals pointing to specific editorial decisions that failed the audience.
Cliff Drops
A sudden, steep loss of 20%+ within a few seconds. Usually indicates a broken promise between your packaging and your content, or a jarring moment that breaks trust.
Gradual Slopes
A steady, consistent decline indicating generally engaged but slowly drifting viewers — often a pacing problem.
Step-Downs
A plateau followed by a sharp drop, then another plateau. These are your most actionable insights: something specific at that timestamp caused a mass exit.
The Opening 30 Seconds
The first 30 seconds of any video are the most consequential real estate in your entire production. This is where viewers make a binary decision: stay or leave. The drop that happens in this window is almost always the steepest on any retention curve, and it is entirely driven by one question forming in the viewer's mind — "Does this content actually deliver on what the thumbnail and title promised me?"
The Critical Opening Window
First 30 SecondsDiagnosing a Failed Hook
A cliff-like drop in the first 15–30 seconds is one of the clearest diagnostic signals in all of video analytics. If you lose 40% or more of your viewers almost immediately, your thumbnail and title packaging has very likely overpromised what the video delivers. The viewer arrived with an expectation, your opening seconds failed to confirm it, and they left to find something that would.
Viewer loss almost immediately can signal that the thumbnail and title packaging has overpromised what the video delivers.
Common causes of opening-phase failure include:
Long intro animations or branded idents
These delay value delivery. Viewers clicked for content, not a logo reveal.
Slow scene-setting
Starting with "Hey guys, welcome back to the channel, today we're going to be talking about…" is the fastest way to signal that your time management skills don't respect the viewer's time.
Muffled, unclear, or unbalanced audio
Poor audio quality in the first 5 seconds triggers immediate abandonment, even if the visual content is strong.
A mismatched visual environment
If your thumbnail featured a dramatic setting and your video opens in a flat, plain room, cognitive dissonance kicks in immediately.
Remedies That Work
Fixing your opening is one of the highest-ROI edits you can make to any existing video. The good news: most opening failures share the same solutions.
The Ending and the Loop of Engagement
The final phase of your retention curve — typically the last 15–20% of your video's duration — holds some of the most counterintuitive insights in all of video analytics. Most creators invest enormous effort into strong openings and well-structured middles, then allow their endings to drift into long, meandering outros that actively destroy the engagement momentum they worked so hard to build.
The most striking insight from end-phase retention data is this: viewers consistently abandon a video the moment they sense it is wrapping up — often 30 to 60 seconds before the actual final frame. This is not viewer impatience; it is a learned behavioral response. Audiences have been conditioned by years of content that follows a predictable structure:
The phrases that trigger this response are now deeply encoded in audience pattern recognition:
The most effective remedy, validated across audience retention research, is the abrupt ending. Rather than decelerating into a traditional outro, end the video at the moment your final point lands — with full energy, no wind-down.
Beyond the abrupt cut, consider transitioning directly into your next piece of content. This technique — borrowed from streaming platform autoplay mechanics — uses the viewer's existing momentum to redirect them immediately into another video. A brief, energetic end-card that previews your next video, or a verbal bridge like:
keeps your audience trapped in a loop of engagement rather than releasing them back to the algorithm.
End on your strongest line. The final frame should feel like punctuation, not ellipsis.
Viewers will remember the last thing they heard with clarity and emotion.
If your content was clear, a summary is redundant. If it wasn't clear, a summary won't save it.
Cut the recap and trust your audience's intelligence.
Place your end-card recommendation at the exact moment value ends, not after an outro. The viewer's impulse to click "next" is highest at peak engagement, not after a 45-second wind-down.
What's Your Reaction?